Backtrace screen
This screen describes the backtrace of the current thread your program has stopped in. Each line of this screen describes the current Frame. What are frame and backtrace by the way? Let's step back a little bit and look at how Ruby executes your code. Internally, Ruby uses an interpreter to read and execute your code, line by line (technically it executes YARV instructions, but let's keep things simple). When it encounters a chunk of code that opens a new scope like a method call or inline block call, the interpreter creates a new structure to store the current context so that it can link to the next scope and go back later. This data structure is called a Frame. The interpreter pushes the frame onto a stack called the backtrace (or stack trace, or call stack, etc), and continues to execute your code. Each thread has a separate backtrace. To understand more deeply, you may be interested in this wonderful slide deck: Grow and Shrink - Dynamically Extending the Ruby VM Stack.
Overall, the whole backtrace screen lets you know where you've stopped, and shows you the trace of how your program is running. When combined with other tools and screens, you'll be surprised by how much information the debugger can give you when you're trying to track down a challenging bug.
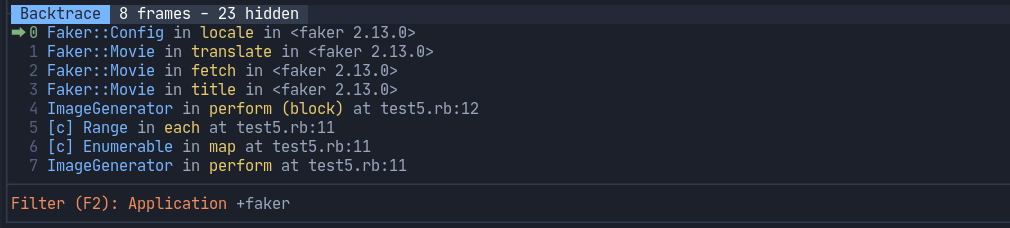
Each frame includes the following information:
- Frame ID: incremental, can be used to jump to an arbitrary frame with the frame command.
- Location label: a class name and method name of the method covers its frame.
- Physical location: exact file name and line number.
- If a frame is allocated in a gem, the physical location shows a gem name and version only. For example:
Calendar::GeneratedAssociationMethods in events in <activerecord 6.0.3.1>. - If there is a
[c]prefix in front of a class name, it means that the method is provided by Ruby, implemented in C, and impossible to peek at. For example:[c] Range in each at test5.rb:11. - If a frame is from standard library, the location has the
stdlibprefix. For example:Random::Formatter in uuid in <stdlib:securerandom>
- If a frame is allocated in a gem, the physical location shows a gem name and version only. For example:
If a frame is filtered out, it won't be displayed. The top title displays overall hidden frames. To navigate through the backtrace, you can use the filter feature combined with the up command, down command, and frame command.